Thoughts on Auckland vehicle density
19/01/2015
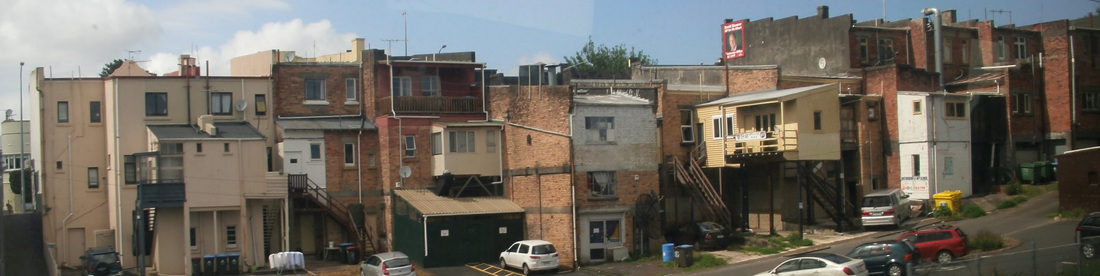
Back of Mount Albert shops from the train
One aspect of train travel is the distinctive view of the city it provides.
Travel across the city by road, and all you see is perhaps the motorway, a few urban thoroughfares, and possibly a few side-streets at either end.
Travel by train, however, and you see a cross-section of the city; back yards, suburban side streets, minor blocks of shops, apartment back entrances, small parks, playing fields etc.
As I saw the view roll by the other day, I became conscious of how often I had remarked to myself about the large quantity of parked cars on West Auckland suburban properties and streets. What once were quiet small streets of single-family dwellings are teeming with vehicles.
It is fairly obvious that in some streets almost none of these dwellings any longer hold single families. They will have four or five cars on or outside the property, and will have been either let to a group, or subdivided and let. I began to wonder just how quantifiable this change is.
On first checking, I found recent stats easy to find, but earlier ones, not so much.
Statistics New Zealand's Living Density Tables give me: -
Occupied Dwellings Per km2
for Private Occupied Dwellings
Auckland Region
1996 58.7
2006 72.4
Occupied Dwellings Per km2
for Private Occupied Dwellings
Auckland Region
1996 58.7
2006 72.4
This is an 18.86% increase, but signifies the increase in medium-density and apartment living only. (Gisborne & Southland under 3% rise for the same period!)
I am interested in the increase in people per section since, say, 1960 or so, when I noticed houses in my suburb being replaced by concrete based brick and tile or concrete block units. This would possibly be one of the earliest times I began to realise that society was not unchanging.
I am interested in the increase in people per section since, say, 1960 or so, when I noticed houses in my suburb being replaced by concrete based brick and tile or concrete block units. This would possibly be one of the earliest times I began to realise that society was not unchanging.
"Occupancy Rate for Usually Resident Households"
Auckland Region
1991 2.87
2001 2.89
Auckland Region
1991 2.87
2001 2.89
Little has changed by way of household size, but this is no help, as it doesn't account for number of households per section.
"Percentage of Households Usually Resident in Each Dwelling Type for Households in Private Occupied Dwellings"
Western Auckland Zone
Census Year Dwelling Type
1991 1996 2001
87.2 87.8 85.3 Separate House
7 7.3 8.6 Two Flats/ Units/ Townhouses/ Apartments/ Houses Joined Together
4.7 4.1 4.6 3 or More Flats/Units/Townhouses/Houses/Apts Joined Together
0.4 0.3 1 Flat/Unit/Townhouse/Apartment or House Joined to or Part of a Biz or Shop
0.7 0.4 0.5 Other Private Dwellings
I don't think this covers number of households per section either!
It does show an increase in households living in Two Flats/ Units/ Townhouses/ Apartments/ Houses Joined Together, but I think this means joined by building alteration, not carved separately out of a single dwelling, i.e. subdivided.
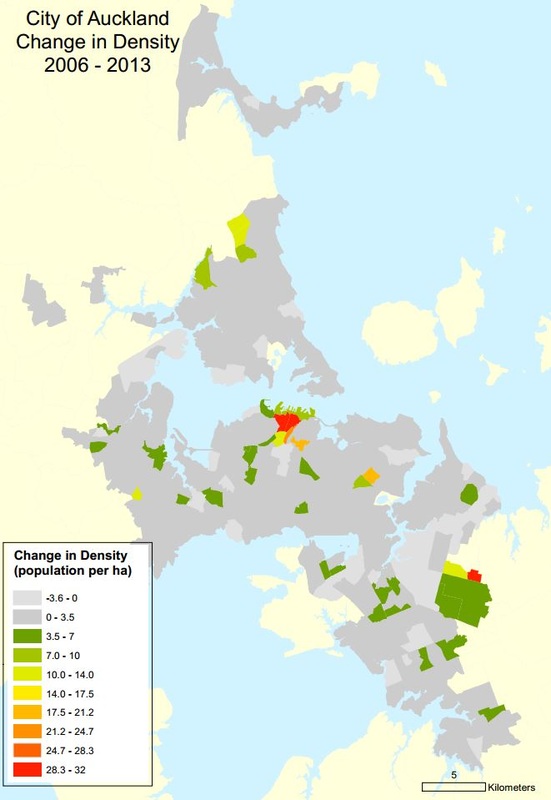
Judging by the map below, I have to concede my impression
will have to remain just that, an impression.
Major changes in density are limited to a few areas, and the higher vehicle density is not something I could find any figures on. It would seem replacing a family with flatters doesn't increase population density and probably counteracts the loss of population caused by empty nest households.
Western Auckland Zone
Census Year Dwelling Type
1991 1996 2001
87.2 87.8 85.3 Separate House
7 7.3 8.6 Two Flats/ Units/ Townhouses/ Apartments/ Houses Joined Together
4.7 4.1 4.6 3 or More Flats/Units/Townhouses/Houses/Apts Joined Together
0.4 0.3 1 Flat/Unit/Townhouse/Apartment or House Joined to or Part of a Biz or Shop
0.7 0.4 0.5 Other Private Dwellings
I don't think this covers number of households per section either!
It does show an increase in households living in Two Flats/ Units/ Townhouses/ Apartments/ Houses Joined Together, but I think this means joined by building alteration, not carved separately out of a single dwelling, i.e. subdivided.
Judging by the map below, I have to concede my impression
will have to remain just that, an impression.
Major changes in density are limited to a few areas, and the higher vehicle density is not something I could find any figures on. It would seem replacing a family with flatters doesn't increase population density and probably counteracts the loss of population caused by empty nest households.